What if I told you ignoring ROAS and click-through rates in Facebook Ads reporting can actually boost your Shopify profit?
After scaling Shopify brands with millions in ad spend, I’ve learned profitable growth relies on four simple metrics.
So in this video and article, I’m going to show you precisely these metrics and how to use them to safely scale Facebook ads, no matter your budget.
Get The Facebook Ads Analysis Cheat Sheet for Scaling
Grab the free cheat sheet with the column setup and how to read each metric to grow your store.
Why Most Facebook Ads Reporting Fails Shopify Brands
ROAS might look like the gold standard for judging ad performance, but in reality it is far from stable. A small change in your average order value, a temporary sale, or even a shift in how long it takes customers to buy can send your ROAS swinging wildly. That makes it a lagging metric, a result rather than a reliable signal you can act on in real time.
CTR has a similar problem, but for a different reason. Click-through rate often rewards curiosity rather than purchase intent. An ad with a catchy hook or a surprising image might pull in lots of clicks, but those clicks do not always lead to profitable conversions. In fact, chasing high CTRs can push you towards click-bait style creative that wins attention but loses money once people reach your site.
When you focus on ROAS and CTR, you set yourself up for what I call “metric thrash”, budgets jumping from one ad to another based on surface-level numbers that do not tell the full story. The result is a lot of activity with very little real improvement in profit.
The fix is to strip back the noise and focus on the handful of metrics that consistently explain why an ad is working or failing. By tracking only the numbers that reveal audience quality, creative strength, acquisition cost, and algorithm confidence, you can make smarter, faster decisions and stop letting vanity metrics dictate your strategy.
The 4 Facebook Ads Reporting Metrics That Changes Everything

Think of Facebook Ads Manager like a loud orchestra. If you try to hear every instrument made of over 300 metrics, you miss the rhythm. Instead, focus on the sections that set the pace. In reporting terms, that means a lean column view that puts Frequency, CPM, CPA, and Amount Spent front and centre.
With this setup, you can spot warm versus cold delivery, gauge creative quality, see your true acquisition cost, and identify the ads Meta’s algorithm wants to back, all at a glance.
When you track these four in one clean view, you can make confident, fast decisions, cutting wasted spend, doubling down on the ads that are working, and avoiding the common trap of chasing numbers that look good but don’t grow your profit. This clarity turns scaling from guesswork into a process.
I’ll show you how focusing on fewer metrics simplifies decision-making in Facebook Ads.
Frequency: Spotting Fatigue Before It Kills Your Facebook Ads
Frequency measures how often someone sees your ad within a set reporting period. It’s one of the most important indicators of whether you’re talking to a fresh audience or repeatedly hitting the same people. A low frequency usually means you’re reaching cold prospects. A higher frequency signals you’re dealing with a warmer audience, people who have already interacted with your brand or are closer to making a purchase.
Tracking this number over a seven-day window can save you from wasting budget. If a cold ad’s frequency starts climbing quickly, it’s a sign that fatigue is setting in. At that point, either reduce the budget or swap in new creative before performance drops. On the flip side, if a warm or remarketing ad has a low frequency, you may not be showing up often enough to convert those prospects into customers.
High spend ad accounts doing $1k per day or more can breakdown reporting by day then make decisions off this data.
I’ve seen the impact of this first-hand. In one campaign, an ad’s frequency climbed to 5 within seven days. I cut its budget in half, expecting revenue to drop. It didn’t- sales held steady, but costs dropped, which meant profit jumped instantly. That’s the kind of decision frequency data allows you to make with confidence.
As a general guide, cold ads often hover around 1 to 2, while warm audiences trend higher. So from this, you can figure out what creative type your ad account needs to scale based on any creative gaps. But every account is different, so always judge frequency within your own campaigns and time windows rather than applying a blanket rule.

CPM (Cost per Mille) – Your Ad Quality and Audience Insight
CPM is the cost to show your ad 1,000 times, and it’s one of the fastest ways to understand both your audience type and how engaging your ad really is. When people watch, click, comment, and interact with your ads, Meta rewards that engagement with a lower CPM. When the opposite happens, your CPM rises, sometimes sharply.
The key is to compare CPMs inside your own account rather than chasing some industry “benchmark.” In most cases, cold ads have lower CPMs because they’re targeting a broad audience. Warm audiences are smaller, so the cost to reach them is naturally higher. That’s not a problem, it’s just the reality of working with limited audience size.
An example in the video above is a warm ad with a CPM of $52 which was double that of others. That same ad had the highest spend and the lowest CPA in the account. It was a clear middle-of-funnel winner that Meta’s algorithm wanted to push. High CPM by itself isn’t always bad.
Be careful though, CPM data can get messy if you’re using interest or lookalike targeting because those audiences are artificially constrained. If you want cleaner, more consistent CPM numbers that tell the real story, run broad targeting. That’s where CPM becomes one of your sharpest tools for analysis.

CPA (Cost per Acquisition): The Reliable Profit Measure
CPA tells you the real cost to acquire a customer. Unlike ROAS, which can swing around depending on discounts or delayed attribution, CPA stays fixed to the bottom line: how much you actually paid for a sale.
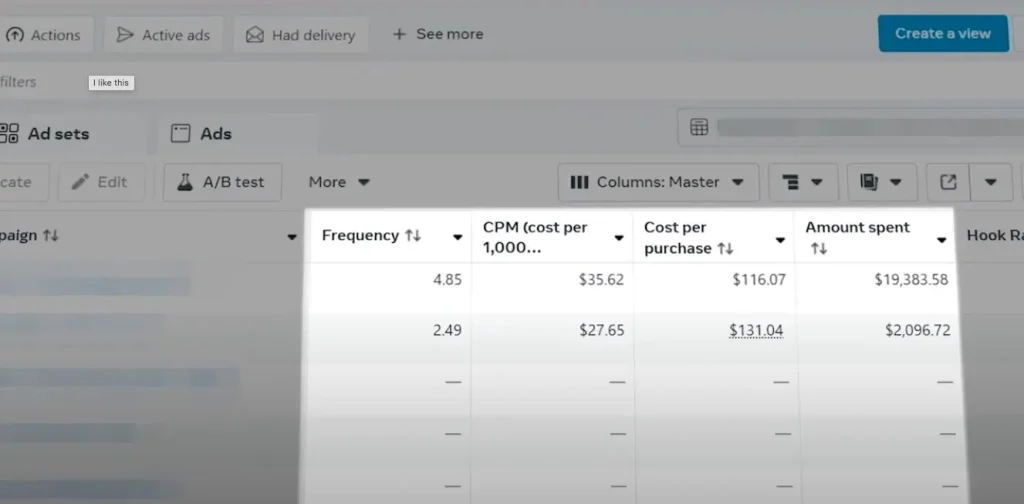
The screenshots here show a real campaign in motion. At the start, the ad looked like a dud. The CPA was sitting at $169 with almost $1,900 already spent. On paper, that’s the kind of number that makes you want to pause the ad instantly.
But here’s where context matters. That ad had Meta’s highest confidence score with the biggest budget allocation, which is often a signal worth trusting. Instead of killing it, we let it run. Seven days later, the story had flipped. The CPA dropped from $169 to $118, making it the strongest-performing ad set in the account.
This is why you can’t judge performance on CPA or any one metric alone. Cold audiences will always cost more upfront. Before you pull the plug, check the bigger picture with frequency, CPM, and spend. An ad that starts expensive can, with enough runway, settle into being your best performer.

Amount Spent: Meta’s Vote of Confidence
Amount Spent looks basic, yet it is one of the clearest signals you have. Meta spends more on ads it trusts. When an ad consistently attracts budget, the algorithm is telling you it believes that ad will scale without breaking performance. That makes spend your first filter when you open Ads Manager.
Here is how to use it. Sort your ads by Amount Spent, highest to lowest. Start your analysis at the top, not the middle. Then layer in the other three metrics to understand why Meta is backing the winners. If the top spender also has a steady CPA, a sensible frequency for the audience, and a competitive CPM, you have a reliable scaling candidate. If spend is high but CPA has blown out, check frequency for fatigue or CPM for weak engagement before you make changes.
Use Amount Spent to decide where to look first, then let Frequency, CPM, and CPA explain what to do next.
Applying These Metrics to Real Facebook Ads Reports
Let’s tie this together with a simple process you can run on a $700 daily campaign. First, sort by Amount Spent. The 80/20 rule applies; a few ads drive most of the outcome, so start where the money is. Confirm delivery is active so you are not diagnosing paused ads.
Next, scan frequency. If a cold ad is already pushing toward 2 across seven days, expect fatigue and either refresh creative or trim budget. If a warm ad has very low frequency, you may be under-serving people who are ready to buy.
Then check CPM. Inside your own account, a higher CPM often means a warmer audience or weaker engagement. A lower CPM usually means broad reach and healthy interaction. Use CPM as a quality and audience signal, not as a scoreboard.
Now judge CPA in context. Cold will be higher than warm. Ask, “Is this CPA sustainable against our profit per order?” If yes, keep or scale. If no, fix the root cause you spotted in frequency or CPM, not just the budget slider.
Avoid the common trap of duplicating “cheap CPA” ads into new ad sets to force more spend. Meta’s own guidance calls this the Breakdown Effect: some ads only look good at low spend and fall apart when pushed. Trust the combination of Amount Spent plus the other three metrics to tell you what can scale without crashing.
Finally, fill your funnel gaps. If nothing shows the patterns of a bottom‑of‑funnel ad, create one with strong benefits and social proof. If cold is weak, build a longer video using Meta Partnership Ads for problem, solution, proof.
For complete help to make decisions of the four metrics, download the free cheat sheet. You’ll get my full column setup and a quick guide on how to read each metric. If you use this every day, you’ll see how much easier it becomes to grow your Facebook Ads. This is the gold inside:

Want more help to grow your Shopify store? Subscribe to the YouTube channel and get the free cheat sheet where you’ll also get my weekly newsletter with actionable tips to get more profitable sales.
What You Should Do Next...
Get More Free Tactics
Subscribe for tutorials and tactics to grow your Shopify store. You'll also immediately download the 30+ page deck "4 Rules of Store Growth: To Sell More on Shopify, Escape Work You Hate, Boost Profit, and Have a Business You're Proud Of".
Work With Us
We partner with a small number of Shopify stores each quarter to scale paid ads, SEO, and conversion rate. If you're serious about growth, apply below. If it's a fit, we'll schedule a call to map out your plan.
APPLY TO WORK WITH US
